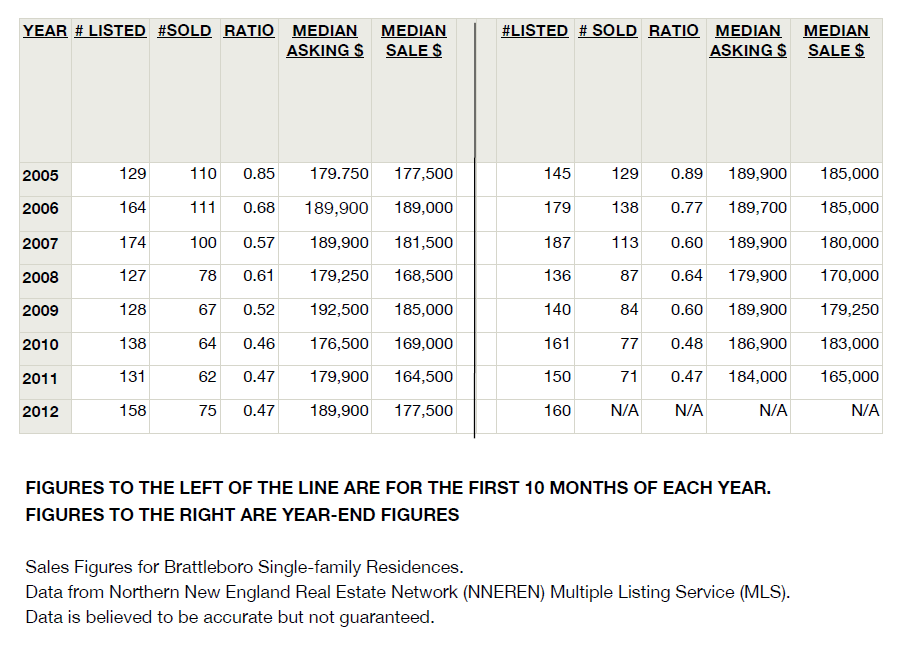
Statistics show that Brattleboro real estate at the end of November is up from this time last year exceeding the rising national trend.
Nationally, the Case-Shiller 20 city index shows a 2% annual rise in home prices, as compared with a 7.3% rise in the median prices of Brattleboro homes sold during the first 10 months of 2012, compared with the same period last year.
According to a recent Standard and Poors press release:
“Home prices continued climbing across the country in August,” says David M. Blitzer, Chairman of the Index Committee at S&P Dow Jones Indices….The sustained good news in home prices over the past five months makes us optimistic for continued recovery in the housing market.”
The Brattleboro real estate market typically follows national trends, but comparatively muted. According to the Standard & Poors release, there was a 30 – 35% fluctuation from the peak of the national real estate market to the bottom. This compares with an 11% drop in median prices of Brattleboro homes from the 2006 peak to the low of 2011.
Perhaps the 2012 year to date 7.3% rise in Brattleboro home prices is a statistical blip, but at least for now the Brattleboro real estate recovery is sprinting ahead of national figures.
The chart below compares Brattleboro home sales, year by year, from 2005 to the present. The left side of the chart shows the first 10 months of each year, the right side shows year-end figures.
In considering real estate historical data, our real intent is to predict the future. So the questions is: What do the first 10 months of 2012 Brattleboro home prices tell us about where Brattleboro real estate is going?

